
Che-Wei (Jarvis) Lee
Data Scientist & Data Analyst · M.S. Data Analytics Engineering @ Northeastern
I build end-to-end ML and analytics that actually ship — a win-probability model that grades every NFL fourth-down call, and a pipeline that has tracked multi-cloud GPU prices every week since June.
About Me
Education
Northeastern University
M.S. Data Analytics Engineering
Expected May 2027 · Boston, MA
GPA: 3.6/4.0
National Changhua University of Education
Bachelor of Business Administration
January 2025 · Changhua, Taiwan
Who I Am
I am a graduate student in Data Analytics Engineering at Northeastern University, passionate about turning complex data into clear, actionable business insights.
I specialize in machine learning, data visualization, and cross-functional storytelling to drive real-world business impact.
Relevant Courses
Skills
Data Analysis
Exploratory Data Analysis Statistical Analysis Data Cleaning & Wrangling Feature Engineering Time-Series Analysis Geospatial Analysis Sports Analytics (EPA/win probability) Sensitivity Analysis Uncertainty Quantification A/B Testing & Experiment DesignBusiness Analysis
KPI Tracking Market & Competitive Intelligence Requirements & Reporting Data StorytellingBI & Dashboards
Tableau Power BI Plotly Excel Interactive Reports (HTML/JS)Programming & AI Tools
Python (pandas, NumPy, scikit-learn) SQL R XGBoost Git / GitHub Actions Model Calibration LLM Evaluation & Benchmarking Testing (pytest)Databases & Cloud
MySQL MongoDB Schema Design AWS Microsoft Azure GCP Google BigQuery SQLite Star Schema / Dimensional Modeling Automated Data Pipelines Public API IntegrationMarketing Analytics
Google Analytics Google Ads Campaign Performance Audience TargetingWork Experience
Chunghwa Telecom 中華電信
Jan 2024 – Jun 2024- Analyzed monthly usage and traffic across 3,000+ AWS customer accounts in Excel and Power BI, delivering monthly reports to the marketing and product managers to guide account priorities.
- Evaluated YouTube vs. Google Ads for a Microsoft 365 campaign with scraped audience and pricing data, informing the final two-channel strategy; monitored weekly ad-performance reports.
- Presented 12+ biweekly competitive-intelligence reports on AWS, Azure, and GCP to the department head; benchmarked ChatGPT, Claude, and Copilot via cross-scoring as LLM tools emerged in early 2024.
- Supported 8 customer-facing seminars (4 M365 Copilot, 3 AWS, 1 Microsoft AI enablement) — hosting clients at the company booth and writing the post-event recap reports — and represented the company at Google Summit.
Projects
SplitLab — Experimentation Platform
LiveMost A/B projects run one t-test on a downloaded CSV. I built the whole platform — assignment, sequential and Bayesian tests, CUPED, SRM — and then proved it works. Across 1,000 simulated experiments with a known answer, A/A false positives land at 5.3% against a nominal 5%; checking the results ten times inflates an ordinary test to 19.5% while mine holds 0.9%.
AskMyDB — Natural-Language SQL
LiveAsk a question in plain English; Claude writes the SQL and DuckDB runs it inside your browser against a 1.16M-row, 13-table warehouse — no server. I benchmarked the models on the same 13 questions with an independent model as the judge: Opus 69%, Haiku 38%. That gap is why the app generates SQL with Opus and only lets Haiku summarise the answer.
MLB 2026 Playoff Predictor
LiveAn ML system that predicts MLB games and 2026 playoff odds — five win-probability models, 10,000 Monte Carlo season simulations, retrained and republished automatically every morning, with every prediction logged before first pitch.
Multi-Cloud AI Infrastructure Analysis
FeaturedA pipeline that has been collecting every week since June — 47,123 GPU price points across all three clouds so far, plus ten years of market share rebuilt from SEC filings. Five live pages, a SQLite star schema, and an event study on whether ChatGPT bent the revenue curve.
U.S. Aerospace Innovation Atlas
FeaturedMapped 16 years of U.S. aerospace patents (5,200+) across 300+ metro areas — and caught a silent data bug that had erased Los Angeles, the #1 metro, from the map; fixed it with CBSA-code joins and validated against official USPTO totals.
NFL Fourth-Down Decision Model
LiveGraded all 15,545 NFL fourth downs from 2021–2024 against a win-probability model I fitted myself. It agrees with the coach 65% of the time; the disagreements are worth 22 wins a season league-wide. Ships with a calculator that answers any fourth down instantly.
CityScore Livability Index
LiveThe crime file I was scoring on had exactly 16,000 rows — and the county API that produced it returns at most 16,000 rows per request. I rebuilt it from source into 25,829 incidents, which changed the ranking, then measured how much of that ranking was ever real: across 10,000 weightings the median area moves 8 places out of 17.
Leadership, Service & Activities
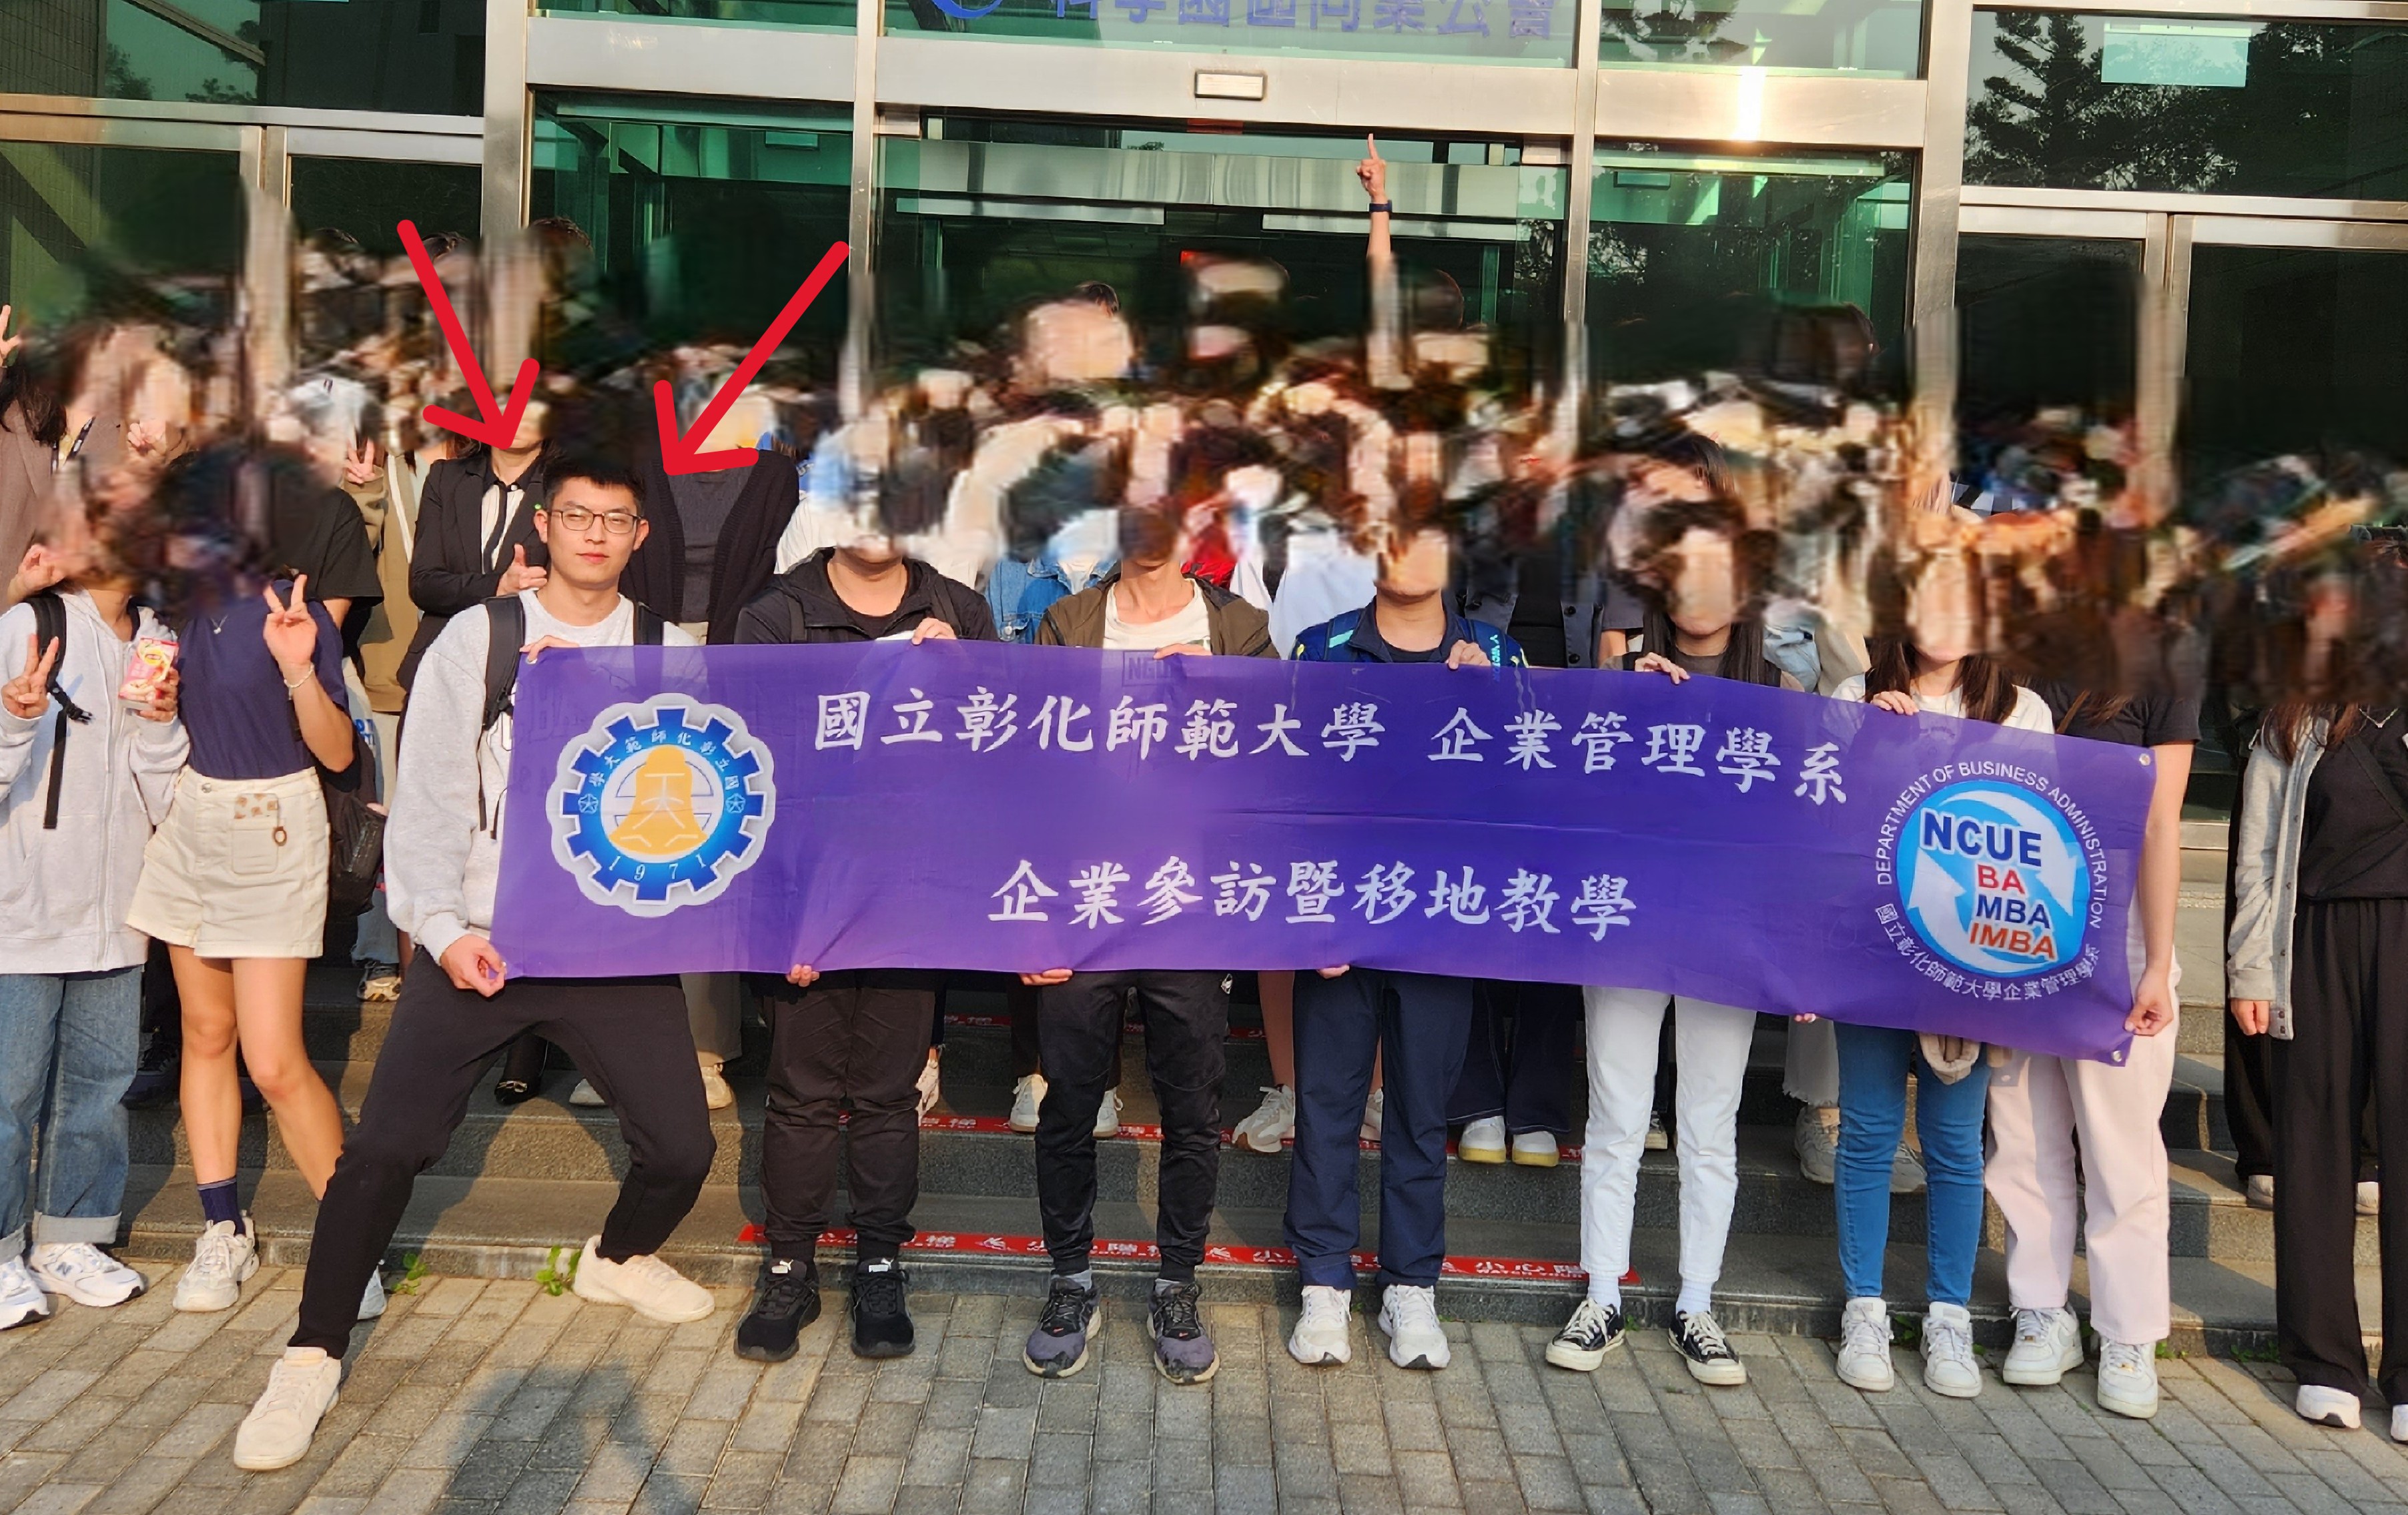 Featured
Department of Business Administration Student Association
- Led the planning and execution of corporate visit projects, including partnership discussions, event flow design, scheduling, and on-site coordination.
- Served as the primary liaison between the department, student association, and corporate partners, aligning stakeholder needs and confirming collaboration logistics.
- Invited industry professionals for campus speaking events, managing speaker outreach, topic planning, and itinerary coordination.
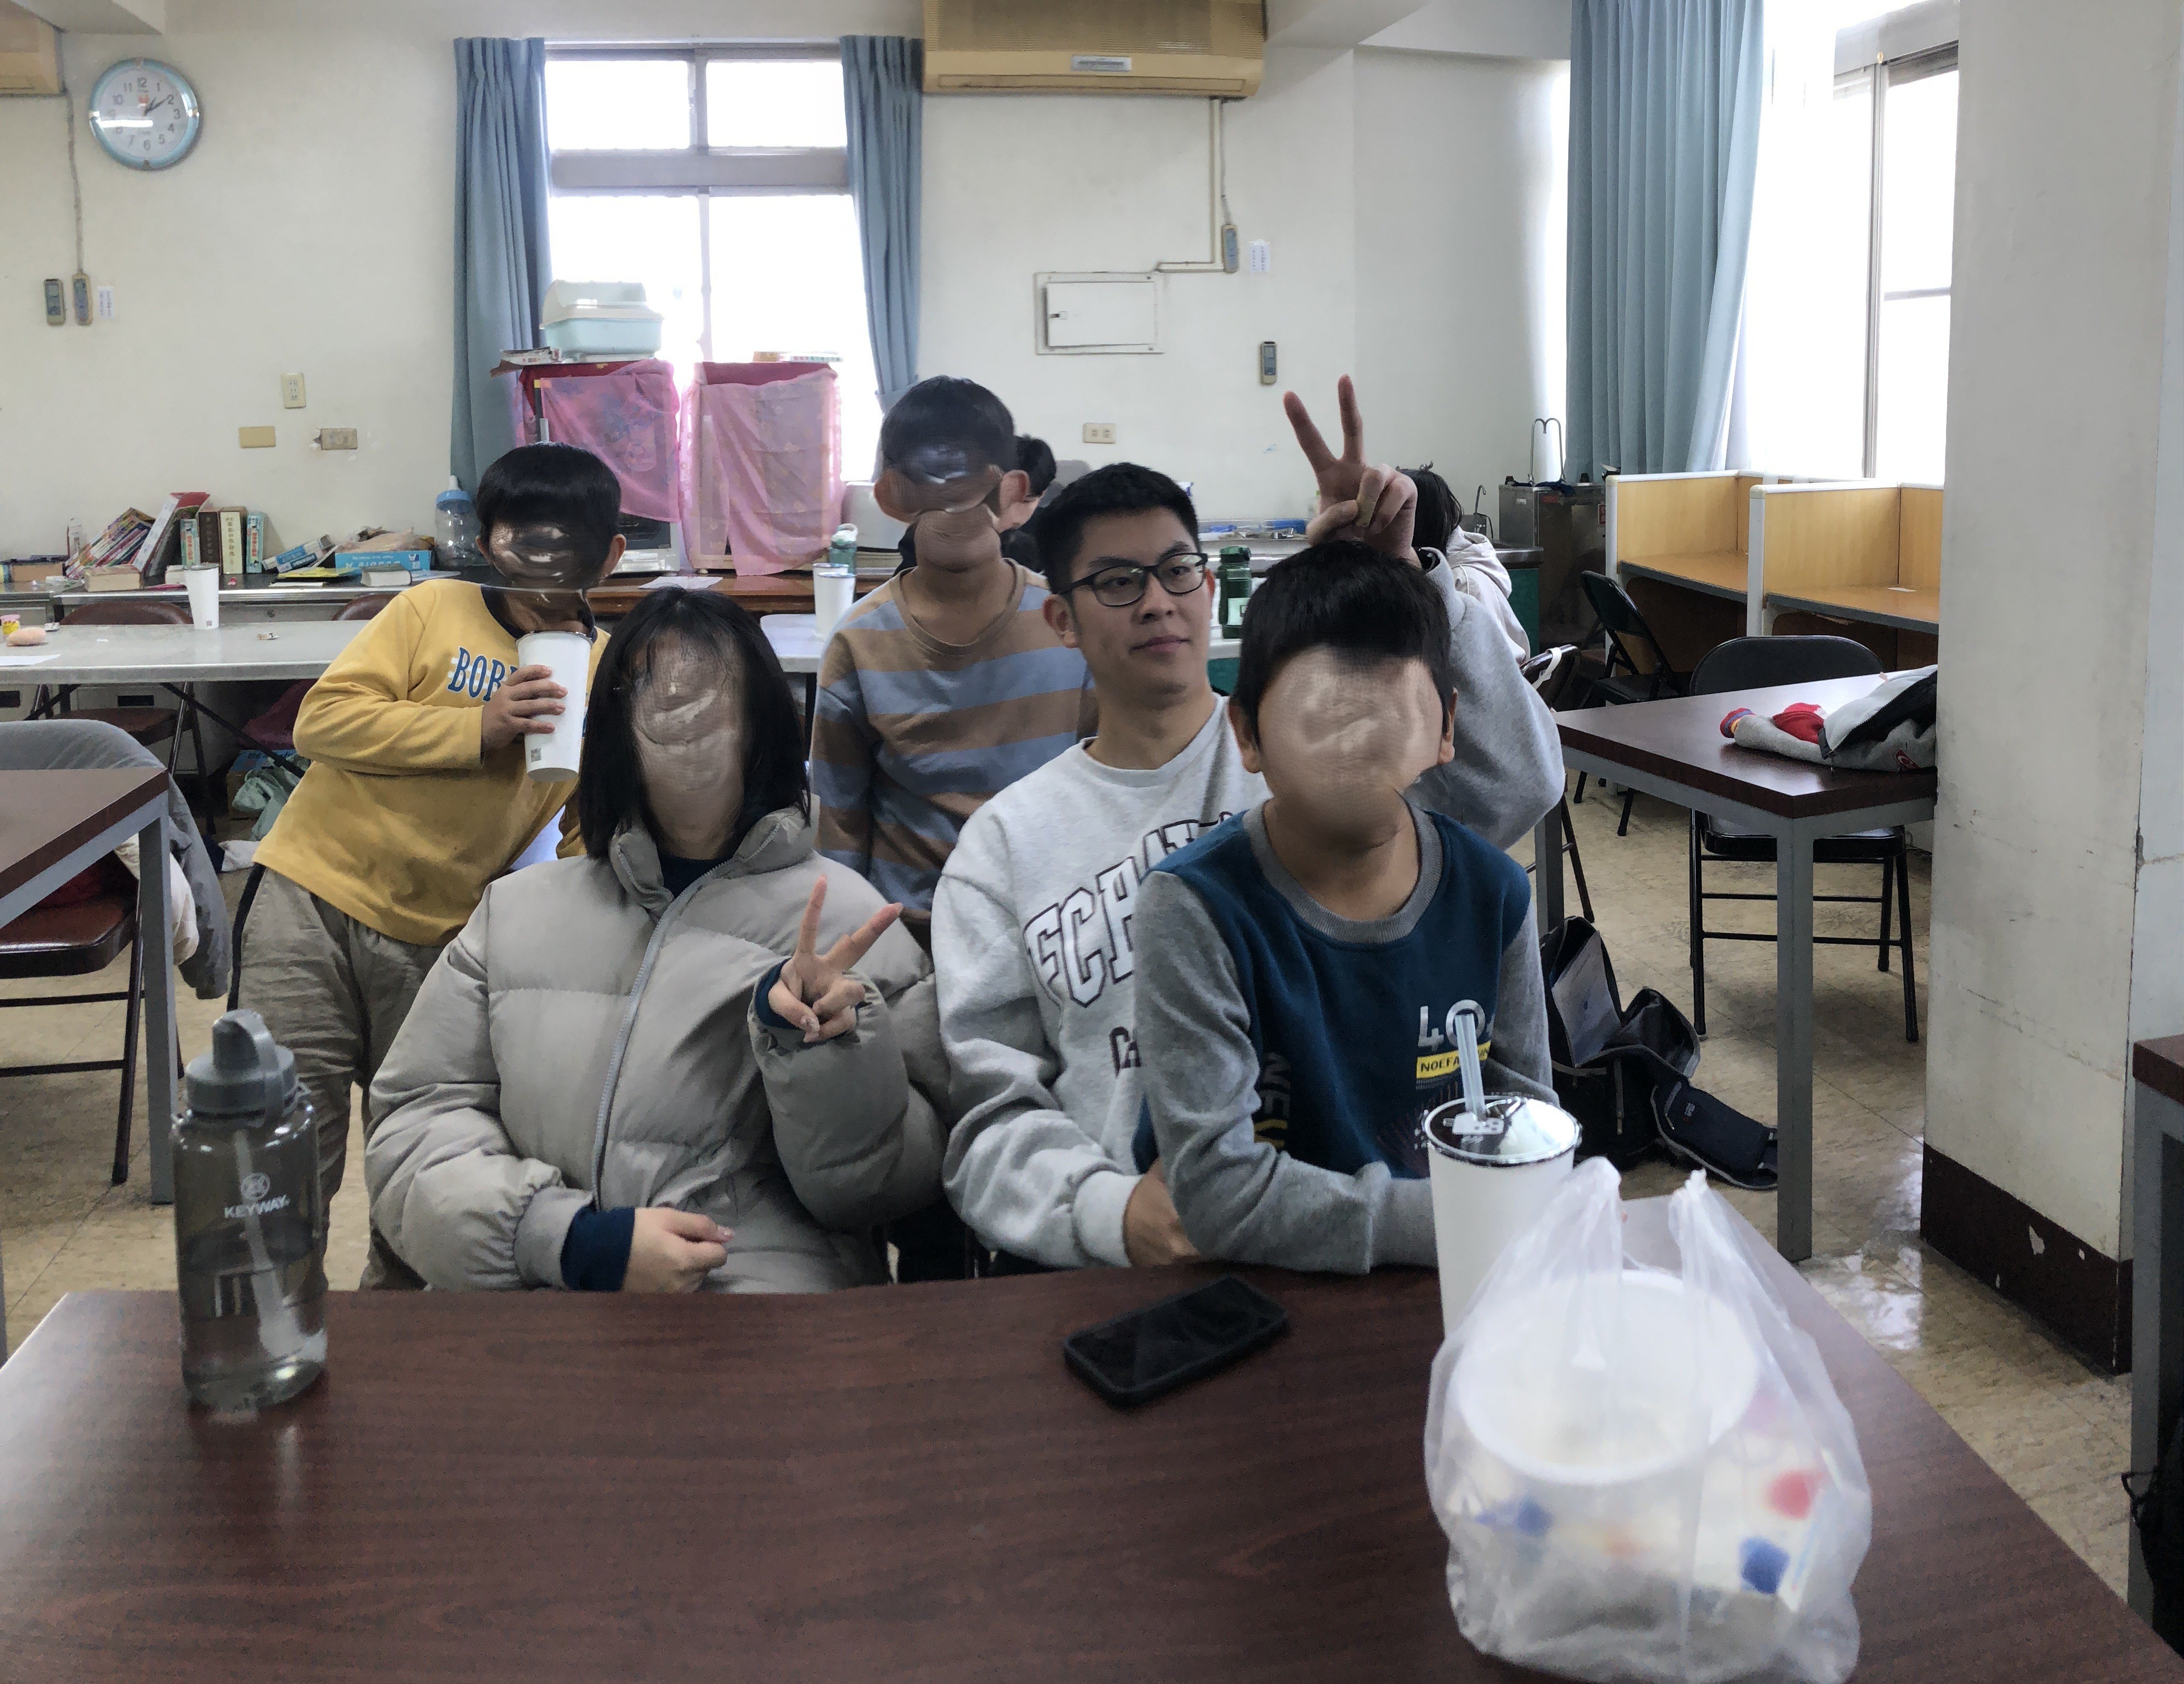
Changhua County Government Underprivileged Family Support Program
- Mentored and tutored students from disadvantaged households, supporting both academic progress and personal development.
- Developed individualized study plans to improve homework completion, study habits, and learning efficiency.
- Strengthened communication, empathy, and leadership skills through direct engagement with students and families in community outreach initiatives.
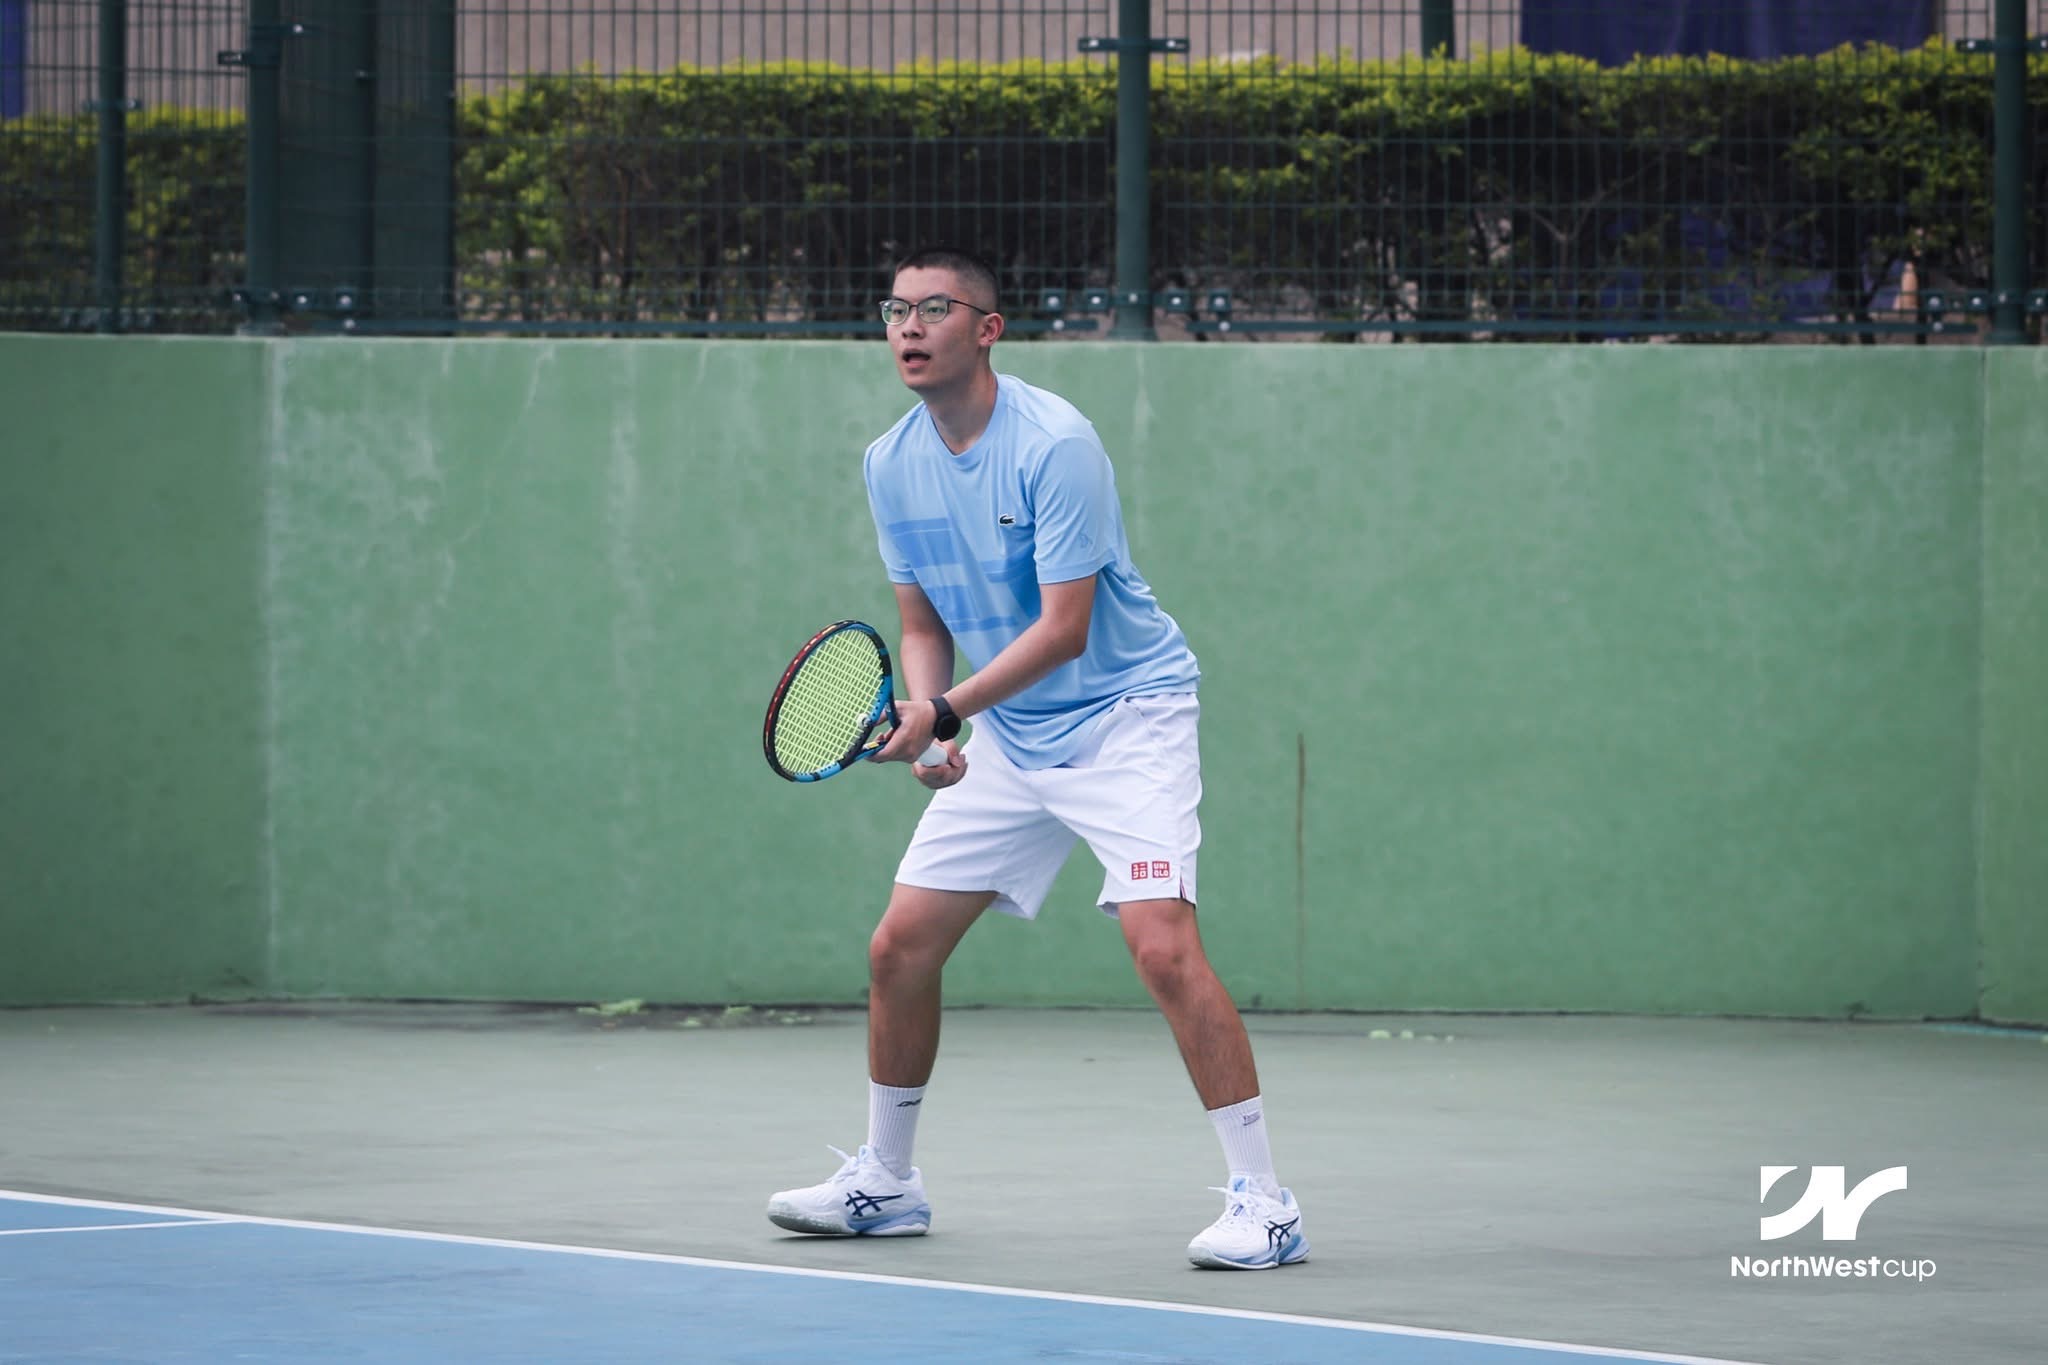
Tennis Club
- Long-term passion for tennis.
- Former member of the university tennis team.
- Developed strong discipline and strategic thinking through competitive sports.